Modern Image Processing Algorithms Overview & Implementation in C
Image processing plays a crucial role in numerous fields, ranging from computer vision and medical imaging to surveillance systems and photography. The implementation of image processing algorithms in programming languages like C has become increasingly important due to the need for efficient and optimized solutions especially on embedded devices where computing power is still limited.
Implementing modern image processing algorithms in C requires a solid understanding of image representation, data structures, and algorithmic concepts. Uncompressed image data are typically stored as matrices or multidimensional arrays, with each element representing a pixel's intensity or color value. C provides the necessary tools to access and manipulate individual pixels efficiently, making it ideal for algorithm implementation. Most of the algorithms featured here except the patented SIFT & SURF are already implemented in the open source, embedded, computer vision library SOD, and already in production use here at PixLab or FACEIO.


More importantly, the intent of this article is to sensibilize the reader that a machine learning approach is not always the best or first solution to solve common Computer Vision problems. Standard image processing algorithms such as Skeletonization, Hough Transform, etc. when mixed and used properly, are traditionally faster than an ML based approach, yet powerful enough to solve those common computer vision challenges.
- Image Thinning/Skeletonization (Hilditch's Algorithm)
- Image Segmentation
- Otsu's Method
- Minutiae Features Extraction
- Hough Transform
- Canny Edge Detection
- Scale-Invariant Feature Transform (SIFT)
- Sobel Operator
- Speeded Up Robust Features (SURF)
- BLOB Detection
- Conclusion
- References
Image Thinning/Skeletonization (Hilditch's Algorithm)
Thinning is the operation that seeks a connected region of pixels of a given property set to a small size. Other terms commonly used are "Shrinking", or "Medial Axis Transformation"[1]. Image thinning, is a morphological operation that aims to reduce the width of the regions or objects in a binary image while preserving their connectivity and topology. The goal is to obtain a one-pixel wide representation of the objects in the image, which can be used for further processing or analysis. Image thinning is typically achieved by repeatedly applying a structuring element or a kernel to the binary image, and removing pixels that match certain conditions, such as having fewer neighbors or not being part of a continuous curve.
Skeletonization on the other side is the process of transforming binary or grayscale images into a simplified representation that captures the geometric and topological properties of the objects in the input image. Skeletonization provides a simple, yet smart technique by discarding off as many pixels as possible of the target pattern while capturing its essential geometric features without affecting the general shape. That is, after application of the thinning process, the general shape of the object or pattern should still be recognizable[2]. Skeletonization is useful when we are interested not in the size of the pattern but rather in the relative position of the strokes in the pattern[8]. The aim of the skeletonization is to extract a region-based shape feature representing the general form of an object.
Image thinning and skeletonization are two important techniques in image processing used to extract and represent the "skeleton" or "centerline" of an object or shape in a binary or grayscale image. They are commonly used in various applications such as computer vision, pattern recognition, medical imaging, and robotics. The skeleton of a binary object as shape descriptor has been proven to be effective for many applications fields. Popular applications of skeletonization include Optical Character Recognition, Medical Imagery, Pattern & Gesture Recognition, and so forth. The thinning process is always the first pass in modern Computer Vision applications and is heavily used here at PixLab for our Passports & ID Cards Scanning API Endpoints (Blog post announcement discussed here).
One of the most widely used algorithm for Skeletonization is the Hilditch's algorithm which given an input binary image of some pattern, should produce the following output:
Input Binary Image

Hilditch's Algorithm Output

Hilditch's algorithm is a popular algorithm for image thinning, which reduces the width of regions or objects in a binary image while preserving their connectivity and topology. It was proposed by Richard Hilditch in 1968 and is commonly used for extracting the skeleton or centerline of objects in an image. The algorithm require a binary image as its input to operate. Otherwise, the result is undefined.
The basic idea of Hilditch's algorithm is to iteratively scan the binary image and remove pixels that meet certain conditions, until no more pixels can be removed. The algorithm typically operates on a binary image where the objects of interest are represented by foreground pixels (usually denoted as white) and the background is represented by background pixels (usually denoted as black).
Hilditch's algorithm iteratively removes pixels from the binary image based on the predefined conditions until the objects in the image are thinned to the desired level, resulting in a one-pixel wide representation of the objects, which can be used for further analysis or processing. It's worth noting that the performance and accuracy of Hilditch's algorithm can be affected by factors such as the input image quality, object shape and size, and the choice of conditions for pixel removal, and it may require parameter tuning or modifications for specific applications.
Hilditch's algorithm has been successfully implemented in SOD via the exported function sod_hilditch_thin_image(). The gist below highlight a typical usage of the Hilditch's algorithm to produce the image output displayed in the section above.
- The image is loaded in the grayscale colorspace first via call to sod_img_load_from_file() on line 45.
- The grayscaled image is binarized on line 52 via call to sod_threshold_image(). This is a mandatory step as Hilditch's algorithm require an input binary image to operate.
- Hilditch's thinning starts when we pass the binary image verbatim on line 54 to sod_hilditch_thin_image().
- The steps of Hilditch's algorithm are as follows:
- Start with the original binary image.
- Scan the binary image pixel by pixel in a systematic way, typically from left to right and top to bottom. For each foreground pixel encountered, check its neighbors to determine if it can be removed according to a set of predefined conditions.
- Hilditch's algorithm uses a set of four conditions for pixel removal, which are based on the connectivity and topology of the object in the image.
- If a foreground pixel meets one of the conditions for removal, it is removed (i.e., set to background) in the current iteration. The binary image is then updated accordingly.
- Repeat the scanning and pixel removal steps until no more pixels can be removed in a pass. This is typically determined by checking if any changes were made to the binary image in the current iteration.
- Stop the algorithm when no more pixels can be removed in a pass, and the binary image has reached the desired level of thinning.
- Finally, the output image is saved to disk via call to sod_img_save_as_png() on line 56.
Both image thinning and skeletonization are used to reduce the complexity of an object or shape in an image while preserving its essential characteristics. They can help in extracting useful features, such as the shape, orientation, and connectivity of objects, and can be used as a pre-processing step for various image analysis tasks such as content filtering. However, it's important to note that the choice of the thinning or skeletonization algorithm, as well as the input image quality and characteristics, can greatly affect the results and accuracy of these techniques.
Image Segmentation
Image segmentation is an umbrella term that includes a set of techniques for image processing based on applying a dividing strategy (i.e. a single image is divided in multiple parts)[5]. After the dividing process, each one of the image components is used for a specific purpose, for example, to identify objects or other relevant information. Several methods are used for image segmentation: Thresholding, Color-based, Texture Filters, Clustering, among others. An effective approach to performing image segmentation includes using existing algorithms and tools, and integrating specific components for data analysis, image visualization, and the development and implementation of specific algorithms[5]. The goal of image segmentation is to partition an image into semantically meaningful regions that can be further analyzed, processed, or understood by a computer.
Image segmentation has numerous applications in fields such as medical imaging, autonomous vehicles, image editing, object & face recognition where it is heavily used on FACEIO, our facial authentication web framework (Blog launch announcement here). Image segmentation provides a foundation for higher-level image analysis tasks, such as object detection, object tracking, and image understanding, as it can facilitate the extraction of relevant information from images at a more granular level.
There are various methods for image segmentation, ranging from traditional to more advanced techniques, including:
- Thresholding: This is a simple and widely used method that involves setting a threshold value on the intensity or color of an image, and pixels above or below this threshold are assigned to different segments. It is based on the assumption that the intensity or color values of the objects of interest are distinct from the background.
- Region-based segmentation: This method groups pixels or regions based on their similarity in terms of intensity, color, or other visual properties. It involves techniques such as region growing, region splitting and merging, and clustering algorithms, such as k-means clustering and mean-shift clustering.
- Texture-based segmentation: This method focuses on identifying regions with similar texture patterns. Techniques such as texture analysis, texture filters, and statistical methods can be used to segment an image based on its texture properties
- Deep learning-based segmentation: With the advent of deep learning, convolutional neural networks (CNNs) and other advanced machine learning techniques have been applied to image segmentation tasks. These methods learn to segment images based on large amounts of labeled training data, and can achieve high accuracy and robustness in many segmentation tasks.
One of the most popular approaches for image segmentation is through thresholding. Thresholding takes a grayscale image and replaces each pixel with a black one if its intensity is less than some fixed constant, or a white pixel if the intensity is greater than that constant. The new binary image produced separates dark from bright regions. Mainly because finding pixels that share intensity in a region is not computationally expensive, thresholding is a simple and efficient method for image segmentation[5].
Several approaches have been proposed to define thresholding methods. According to the categorization defined by Sezgin and Sankur[7], six strategies were identified[5]:
Histogram Shape Methods, which uses information from the image histogram.
Clustering Methods, which groups objects in classes, i.e. Background or Foreground.
Entropy Methods, which make use of entropy information for foreground and background, or cross-entropy between the original and the binary image.
Object Attribute Methods, which evaluate and use the similarities between the original and the binary image.
Spatial Methods, which apply higher-order probability distribution and/or correlation between pixels.
Local Methods, based on adapting the threshold value to locally defined characteristics.
Various thresholding & edge detection techniques are widely available and implemented in SOD via sod_binarize_image(), sod_threshold_image(), sod_canny_edge_image(), sod_sobel_image(), etc.
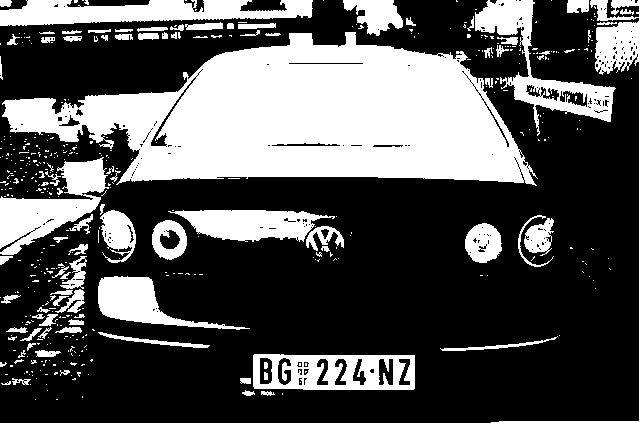
Input (Grayscale colorspace) Image

Fixed Thresholding Output

The gist below showcase how to obtain a binary image via fixed thresholding to produce the image output displayed above.
- The image is loaded in the grayscale colorspace first via call to sod_img_load_grayscale() on line 38.
- The grayscaled image is binarized via fixed thresholding on line 47 via call to sod_binarize_image().
- This binary image is further eroded on line 49 via call to sod_erode_image().
- Finally, the output image is saved to disk via call to sod_img_save_as_png() on line 51.
Otsu's Method
Put it simply, Otsu's method (named after Nobuyuki Otsu) is a popular thresholding algorithm for image segmentation, belonging to the clustering category, and is usually used for thresholding and binarization. Thresholding is used to extract an object from its background by assigning an intensity value T (threshold) for each pixel such that each pixel is either classified as foreground or background point.
Otsu's method is a simple yet effective method for image thresholding, as it automatically determines the threshold value without requiring any user-defined parameter. It has been widely used in various image processing applications, such as image segmentation, object detection, and image analysis. However, it may not be suitable for all images or scenarios, as it assumes that the foreground and background classes have distinct intensity or color values, and may not perform well in cases where this assumption is not met
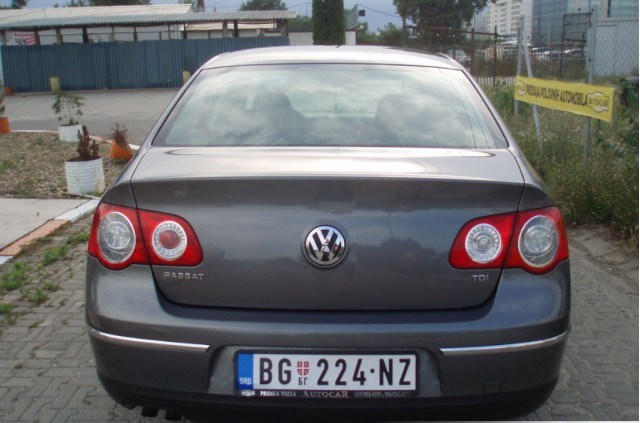
Input Image
Otsu's Algorithm Output

Otsu's method works mainly with the image histogram, looking at the pixel values and the regions that the user wants to segment out, rather than looking at the edges of an image. It tries to segment the image making the variance on each of the classes minimal. The algorithm works well for images that contain two classes of pixels, following a bi-modal histogram distribution. The algorithm divides the image histogram into two classes, by using a threshold such as the in-class variability is very small. This way, each class will be as compact as possible. The spatial relationship between pixels is not taken into account, so regions that have similar pixel values but are in completely different locations in the image will be merged when computing the histogram, meaning that Otsu’s algorithm treats them as the same[5]. The algorithm works as follows:
- Compute the histogram of the input image:: The histogram is a graph that shows the distribution of pixel intensities or color values in the image. It represents the frequency of each intensity or color value occurring in the image.
- Normalize the histogram: Normalize the histogram by dividing each bin value by the total number of pixels in the image, so that the sum of all bin values is equal to 1. This step is necessary to convert the histogram into a probability distribution.
- Compute the cumulative distribution function (CDF): Compute the cumulative sum of the normalized histogram to obtain the cumulative distribution function (CDF). The CDF represents the probability of a pixel having an intensity or color value less than or equal to a certain threshold.
- Iterate over all possible threshold values: For each possible threshold value, compute the between-class variance and the within-class variance. The between-class variance measures the separation between the foreground and background classes, while the within-class variance measures the compactness of each class.
- Compute the optimal threshold: The optimal threshold is determined as the threshold value that maximizes the between-class variance or equivalently minimizes the within-class variance. This can be done by iterating over all possible threshold values and selecting the one that gives the maximum between-class variance or the minimum within-class variance.
- Threshold the image: Once the optimal threshold value is determined, the image is thresholded by assigning pixels with intensities or color values greater than the threshold to the foreground class (object of interest) and pixels with intensities or color values less than or equal to the threshold to the background class (non-object region).
Otsu's method has been successfully implemented in SOD via the exported function sod_otsu_binarize_image(). The gist below highlight a typical usage of the Otsu's algorithm to produce the image output displayed above.
- The image is loaded and converted inline to the grayscale colorspace via call to sod_img_load_grayscale() on line 38. This is a mandatory step as Otsu thresholding require an input image in the Grayscale colorspace to operate.
- Otsu's thresholding starts when we pass the grayscaled image on line 47 to sod_otsu_binarize_image().
- Finally, Otsu's thresholded image output is saved to disk via call to sod_img_save_as_png() on line 49.
Minutiae Features Extraction
Minutiae features extraction is a common technique used in fingerprint recognition, which is a widely used biometric authentication method in computer vision. Fingerprint recognition is based on the unique and distinct ridge patterns and characteristics present in fingerprints, which are used to identify individuals.
Fingerprints are the oldest and most widely used form of biometric identification. Everyone is known to have mostly unique, immutable fingerprints. As most Automatic Fingerprint Recognition Systems are based on local ridge features known as minutiae, marking minutiae accurately and rejecting false ones is very important. However, fingerprint images get degraded and corrupted due to variations in skin and impression conditions. Thus, image enhancement techniques such as Hilditch Thinning, Thresholding, etc. are employed prior to minutiae extraction. A critical step in automatic fingerprint matching is to reliably extract minutiae from the input fingerprint image[6].
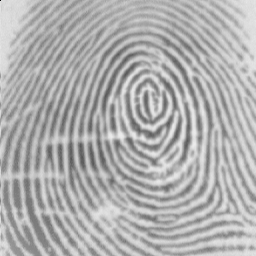
Fingerprints are the most widely used parameter for personal identification amongst all biometrics. Fingerprint identification is commonly employed in forensic science to aid criminal investigations etc. A fingerprint is a unique pattern of ridges and valleys on the surface of a finger of an individual. A ridge is defined as a single curved segment, and a valley is the region between two adjacent ridges. Minutiae points (img.2) are the local ridge discontinuities, which are of two types: ridge endings and bifurcations. A good quality image has around 40 to 100 minutiae[6]. It is these minutiae points which are used for determining uniqueness of a fingerprint.
Input Grayscaled Fingerprint
sod_minutiae() Output
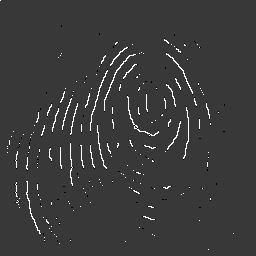
Minutiae are the ridge and valley characteristics or details found in fingerprints, such as ridge endings, ridge bifurcations, and short ridges. Ridge endings are points where ridges terminate, while ridge bifurcations are points where ridges split into two branches. Short ridges are small ridge segments that connect two longer ridges.
Minutiae features extraction has been successfully deployed in SOD via the exported function sod_minutiae(). The gist below extracts ridges and bifurcations from a fingerprint image using sod_minutiae().
- The image is loaded and converted inline to the grayscale colorspace via call to sod_img_load_grayscale() on line 49. This is a mandatory step as minutiae features extraction require an input image in the Grayscale colorspace to operate.
- The grayscaled image is binarized via fixed thresholding on line 56 via call to sod_binarize_image().
- The binarized image is further processed (thinned) on line 59 via Hilditch's Algorithm.
- Minutiae features extraction starts on line 63 when we pass the binary image to sod_minutiae(). This typically involves the following steps:
- Image Preprocessing: The input fingerprint image is first preprocessed to enhance the ridge and valley patterns and remove noise or artifacts. This is already done on our case in the steps outlined above.
- Ridge Detection: The ridge and valley patterns in the fingerprint image are then detected to identify the locations of ridges and valleys. This can be done using techniques such as ridge thinning, ridge tracking, or frequency-based analysis.
- Minutiae Detection: Once the ridge and valley patterns are identified, minutiae points are detected by locating ridge endings, ridge bifurcations, and short ridges. This is typically done by analyzing the local properties of the ridge patterns, such as the directions, orientations, and curvatures of ridges.
- Minutiae Representation: The detected minutiae points are then represented in a suitable format for further processing and comparison. This may involve encoding the minutiae points into a binary or numerical representation, such as a minutiae template or a feature vector.
- Minutiae Matching: The extracted minutiae features are then compared with a pre-existing database of stored minutiae features to identify a match. This can involve various matching techniques, such as one-to-one matching, one-to-many matching, or template-based matching.
- Finally, we extract the total number of BLACK points, bifurcation, and ending points on line 63 via simple call to sod_minutiae().
Hough Transform
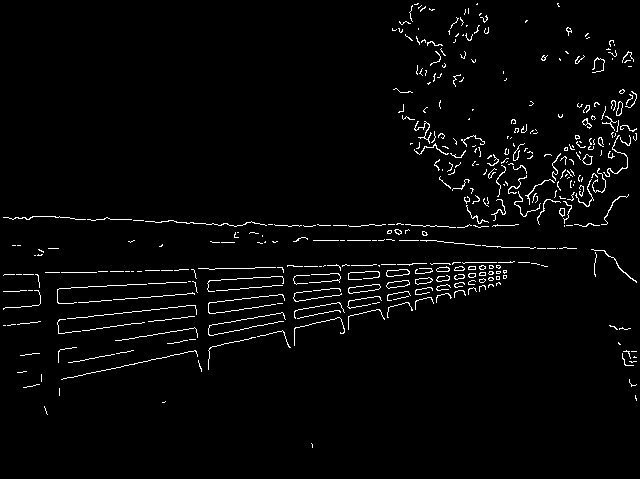
The Hough transform is a popular image processing technique used for detecting lines or other parametric shapes in images. It was developed by Paul Hough in 1962 and has since been widely used in computer vision and image analysis applications. Hough transform works by converting image points from the Cartesian coordinate system (x, y) to a parameter space, known as the Hough space, which is represented by a different set of coordinates, typically denoted as (θ, ρ), where θ represents the angle of the line and ρ represents the perpendicular distance from the origin to the line along the line's normal vector.
Hough transform is a robust technique for detecting lines in images, even in the presence of noise or partial occlusion. It is widely used in various image processing and computer vision applications, such as shape recognition, document scanning, and traffic sign recognition.
Input Binary Image
Hough Lines Detection Output

Hough transform can be used for detecting lines in an input image or video frame using the following steps:
- Edge detection: Typically, an edge detection algorithm, such as the Sobel operator, is applied to the input image to identify edges or boundaries.
- Hough space initialization: A Hough space is created with a 2D accumulator array, where one axis represents the angle θ and the other axis represents the distance ρ.
- Voting: For each edge point detected in the edge detection step, the corresponding (θ, ρ) values are calculated and the accumulator array is updated by incrementing the corresponding bin in the array. This process is known as "voting" and is done to accumulate evidence of potential lines in the Hough space.
- Thresholding: After the voting process, the accumulator array is typically thresholded to identify bins that have received a significant number of votes, which correspond to potential lines in the original image. The threshold value can be determined empirically or using other techniques.
- Line extraction: Once the thresholding is done, the lines can be extracted from the significant bins in the accumulator array. The lines can be determined by finding the peaks or local maxima in the accumulator array, which represent the most likely parameters (θ, ρ) of the detected lines.
- Line representation: Finally, the detected lines in the parameter space (θ, ρ) can be converted back to Cartesian coordinates (x, y) using the inverse Hough transform, and the lines can be drawn on the original image for visualization or further processing.
Hough transform have been successfully implemented in SOD via the exported function sod_hough_lines_detect(). The gist below highlight a typical usage on how to extract straight lines on a given input image or video frame.
- The image is loaded in the grayscale colorspace first via call to sod_img_load_grayscale() on line 38.
- The grayscaled image is thresholded using the Canny Edge Detection Algorithm. This is easily done on line 49 of the gist above via call to sod_canny_edge_image().
- Hough lines detection starts on line 63 when we pass the canny edged image to sod_hough_lines_detect(). On success, line coordinates are returned to the caller. Depending on the analyzed image or video frame, you should experiment with different thresholds for better results.
- For each extracted line coordinates (two sod_pts entries per detected line), a bold rose line is drawn on the output image. This is done via call to sod_image_draw_line() on line 69.
- Finally, the output image with each extracted line is saved to disk via call to sod_img_save_as_png() on line 72.
Canny Edge Detection
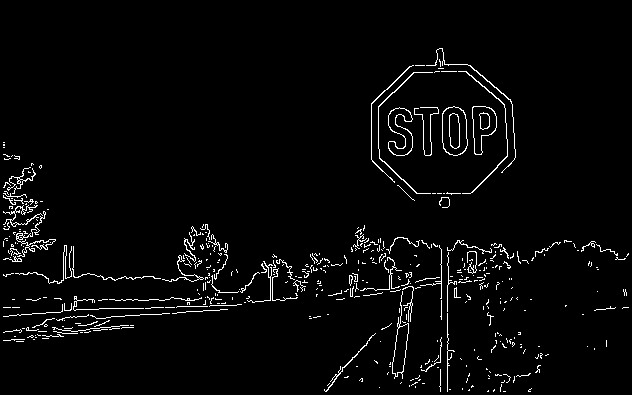
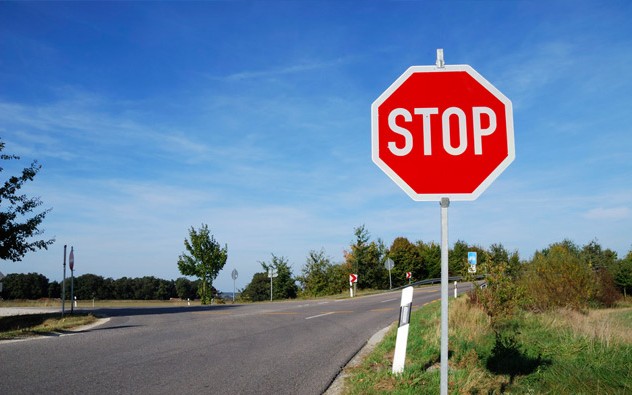
Canny edge is a popular image processing algorithm used for detecting edges in a given image while suppressing noise. It is very popular among computer vision systems, and was developed by John F. Canny in 1986. A typical output of a canny edged image is shown below:
Input Image
Canny Edge Output

The main steps for outputting a canny edged image are:
- Smoothing: Canny edge begins by applying a Gaussian filter to the input image to reduce noise and remove small details. The Gaussian filter is a low-pass filter that blurs the image while preserving the edges.
- Gradient Calculation: The smoothed image is then processed to calculate the gradient magnitude and orientation at each pixel. This step involves computing the derivatives of the image using techniques such as Sobel, or Roberts operators. The gradient magnitude represents the strength of the edge, while the gradient orientation indicates the direction of the edge.
- Non Maximum Suppression (NMS): In this step, the algorithm identifies the local maxima in the gradient magnitude image along the direction of the gradient orientation. It checks if the gradient magnitude at a pixel is greater than its two neighboring pixels in the direction of the gradient. If it is, the pixel is retained as a potential edge pixel; otherwise, it is suppressed.
- Double Thresholding: The algorithm applies two threshold values, a high threshold and a low threshold, to classify the potential edge pixels into strong, weak, or non-edges. If the gradient magnitude of a pixel is above the high threshold, it is classified as a strong edge pixel. If it is below the low threshold, it is considered a non-edge pixel. Pixels with gradient magnitudes between the low and high thresholds are classified as weak edge pixels.
- Edge Tracking by Hysteresis: This final step aims to link the weak edge pixels to the strong edge pixels. It involves analyzing the connectivity of the weak edge pixels. If a weak edge pixel is adjacent to a strong edge pixel, it is promoted to a strong edge pixel. This process is repeated until no more weak edge pixels are connected to strong edge pixels.
Canny edge has been successfully implemented in SOD via the exported function sod_canny_edge_image(). The result of the Canny edge detection algorithm is a binary image where the strong edge pixels form continuous curves representing the detected edges. These edges correspond to the significant changes in intensity or color in the original image. The gist below highlight a typical invocation of the canny edge detection algorithm to produce the image output displayed in the section above.
- The image is loaded in the grayscale colorspace first via call to sod_img_load_from_file() on line 35. This is a mandatory step before starting canny edge detection.
- The canny edge detection process starts when we pass the input grayscaled image on line 42 to sod_canny_edge_image().
- Finally, the output, canny edged image is saved to disk via call to sod_img_save_as_png() on line 44 of the gist above.
Scale-Invariant Feature Transform (SIFT) Algorithm
The scale invariant feature transform (SIFT) algorithm is a widely used, patented method for extracting distinctive and robust features from images. It was proposed by David Lowe in 1999 and has become a fundamental technique in image processing, computer vision, and object recognition tasks. The SIFT algorithm is particularly effective in handling changes in scale, rotation, affine transformations, and partial occlusions.
SIFT, extracts a set of descriptors from an image[10]. The extracted descriptors are invariant to image translation, rotation and scaling (zoom-out). SIFT descriptors have also proved to be robust to a wide family of image transformations, such as slight changes of viewpoint, noise, blur, contrast changes, scene deformation, while remaining discriminating enough for matching purposes.
Original SIFT algorithm flow [14]

SIFT consists of two successive and independent operations: The detection of interesting points (i.e. keypoints) and the extraction of a descriptor associated to each of them. Since these descriptors are robust, they are usually used for matching pairs of images. Object recognition and video stabilization are other popular application examples.
SIFT detects a series of keypoints from a multiscale image representation. That is, it locates certain key points and then furnishes them with quantitative information (so-called descriptors)[12]. This multiscale representation consists of a family of increasingly blurred images. Each keypoint is a blob-like structure whose center position (x, y) and characteristic scale σ are accurately located. SIFT computes the dominant orientation θ over a region surrounding each one of these keypoints. For each keypoint, the quadruple (x, y, σ, θ) defines the center, size and orientation of a normalized patch where the SIFT descriptor is computed. As a result of this normalization, SIFT keypoint descriptors are in theory invariant to any translation, rotation and scale change. The descriptor encodes the spatial gradient distribution around a keypoint by a 128-dimensional vector. This feature vector is generally used to match keypoints extracted from different images.
The figure above, shows a flow diagram of the original SIFT algorithm. Hierarchical algorithm is adopted to obtain robustness to a scale change. The SIFT descriptor generation consists of Gaussian filtering, key-point extraction and descriptor vector generation. The input image is smoothed by Gaussian filtering for key-point extraction. Adjacent Gaussian filtered images are subtracted for difference-of-Gaussian (DOG) generation. Key-point is detected by searching on DOG. Key-point detection uses three DOG images. Maxima and minima of DOG images are detected by comparing a pixel in middle scale to its 26 neighbors in 3×3 regions at the current and adjacent scales. Finally, SIFT descriptor vectors are obtained by calculating a gradient histogram of luminance around the key-point. The whole process can be divided into several key steps as outlined below:
- Scale-space extrema detection: The algorithm first constructs a scale-space representation of the input image by convolving it with a series of Gaussian filters at different scales. This process helps capture image features at different levels of detail. Then, it identifies local extrema (peaks and valleys) in the scale-space representation, which correspond to potential keypoints.
- Keypoint localization: The algorithm applies a difference-of-Gaussian (DoG) operation to the scale-space extrema to enhance the keypoint locations. It performs sub-pixel interpolation to achieve more accurate localization.
- Orientation assignment: The algorithm determines the dominant orientation for each keypoint to make the feature descriptor invariant to image rotation. It uses gradient information around the keypoint to assign an orientation, usually based on histograms of gradient directions.
- Keypoint descriptor generation: A feature descriptor is computed for each keypoint to capture its local appearance and characteristics. The descriptor is constructed based on the distribution of gradient magnitudes and orientations in the local image patch surrounding the keypoint. This descriptor is designed to be invariant to changes in scale, rotation, and illumination.
- Keypoint matching: To compare keypoints across different images, the algorithm performs a matching step. It compares the descriptors of keypoints in different images using techniques like nearest neighbor matching and ratio test. Keypoints with similar descriptors are considered as potential matches.
- Keypoint filtering: The algorithm applies further filtering techniques to eliminate false matches and outliers. This can involve methods like RANSAC (Random Sample Consensus) to robustly estimate the transformation model between matched keypoints.
Finally, an open source C implementation of the SIFT algorithm, can be found at https://github.com/robwhess/opensift.
Sobel Operator
The Sobel operator is a widely used edge detection operator in image processing. It is a simple and computationally efficient filter that is commonly used to detect edges or boundaries between regions of different intensities in an image. The Sobel operator is typically applied to grayscale images, but it can also be used on color images by applying it separately to each color channel.
The Sobel operator works by convolving a small filter or kernel with the input image. The filter is a small matrix typically of size 3x3 or 5x5, and it consists of two separate kernels, one for detecting vertical edges and one for detecting horizontal edges. These two kernels are often referred to as the Sobel operators or Sobel kernels.
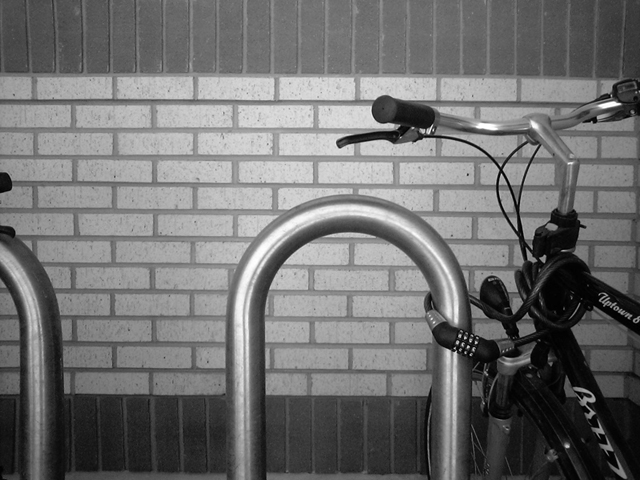
To apply the Sobel operator to an input image, the operator is convolved with the image by placing the kernel at each pixel location and performing element-wise multiplication and summation. The result is a new image, often referred to as the gradient image or edge map, which represents the strength and direction of edges in the original image.
The vertical Sobel operator highlights edges that run vertically in the image, such as edges that represent changes in intensity from top to bottom. The horizontal Sobel operator highlights edges that run horizontally in the image, such as edges that represent changes in intensity from left to right. By applying both vertical and horizontal Sobel operators, the Sobel operator can detect edges in multiple orientations.
The Sobel operator is commonly used in various image processing tasks, such as image segmentation, object detection, and feature extraction. It is a popular choice for edge detection due to its simplicity and effectiveness in highlighting edges in images.
Input Grayscaled Image
Sobel Operator Output
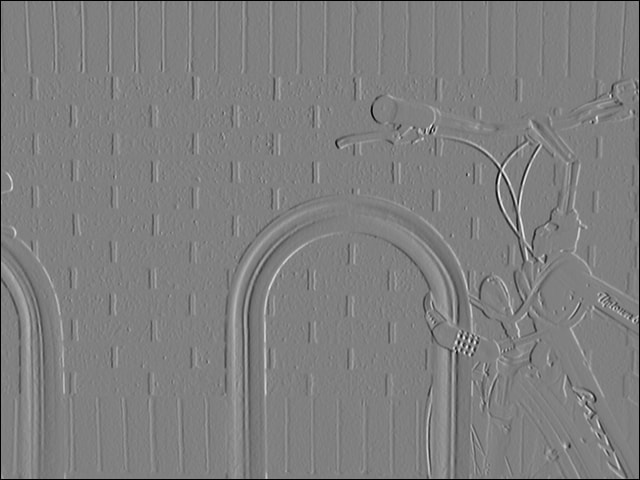
The Sobel operator has been successfully implemented in SOD via the exported function sod_sobel_image(). The gist below highlight a typical invocation of the Sobel operator to produce the image output displayed in the section above.
- The image is loaded in the grayscale colorspace first via call to sod_img_load_from_file() on line 38. This is a mandatory step before starting the Sobel process.
- No need for image binarization or thresholding like other algorithms require as intermediary step. Sobel operation takes place when we pass the input grayscaled image on line 45 to sod_sobel_image().
- Finally, the output image is saved to disk via call to sod_img_save_as_png() on line 47 of the gist above.
Speeded Up Robust Features (SURF) Algorithm
Speeded Up Robust Features or SURF for short is a patented algorithm used mostly in computer vision applications. SURF fall in the category of feature descriptors by extracting keypoints from different regions of a given image and thus is very useful in finding similarity between images. It was introduced by Herbert Bay et al. in 2006 as an efficient and robust alternative to the SIFT algorithm. SURF features are designed to be invariant to scale, rotation, and changes in viewpoint, making them suitable for various image analysis tasks.
SURF Keypoints detection [11]
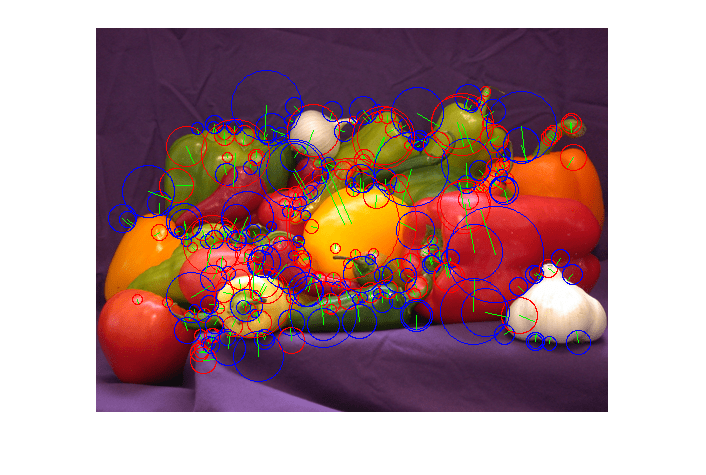
SURF locates features using an approximation to the determinant of the Hessian, chosen for its stability and repeatability, as well as its speed. An ideal filter would construct the Hessian by convolving the second-order derivatives of a Gaussian of a given scale σ with the input image. The SURF algorithm operates as follow:
- Scale-space extrema detection: Similar to SIFT, SURF constructs a scale-space representation of the input image by applying a series of Gaussian filters at different scales. However, SURF uses an approximation technique known as the Box Filter Approximation. Box filters are chosen because they can be evaluated extremely efficiently using the so-called integral image.
- Interest point detection: SURF identifies interest points (keypoints) in the scale-space representation by searching for local extrema over scale and space. These keypoints are locations in the image that are distinctive and stable under different transformations.
- Orientation assignment: For each detected keypoint, SURF determines its dominant orientation to achieve rotation invariance. It computes the Haar wavelet responses in horizontal and vertical directions to estimate the orientation. This information is used to align the local image region around the keypoint.
- Descriptor computation: The algorithm constructs a descriptor for each keypoint to capture its local appearance and characteristics. SURF uses a grid-based approach to divide the region around the keypoint into smaller sub-regions. For each sub-region, it calculates the Haar wavelet responses in horizontal and vertical directions. These responses are then used to generate a compact and robust descriptor..
- Keypoint matching: SURF performs matching by comparing the descriptors of keypoints between different images. It utilizes techniques such as approximate nearest neighbor search and distance ratio test to find the best matches.
Finally, SURF is advertised to perform faster compared to previously proposed schemes like SIFT. This is achieved (as stated by its designers) by:
- Relying on integral images for image convolutions.
- Building on the strengths of the leading existing detectors and descriptors (using a Hessian matrix-based measure for the detector, and a distribution-based descriptor).
- Simplifying these methods to the essential. This leads to a combination of novel detection, description, and matching steps.
BLOB Detection
Blob detection is a commonly used technique in image processing and computer vision for detecting regions or regions of interest (ROIs) in an image that have similar properties, such as intensity, color, or texture. Blobs are typically characterized by their intensity or color properties, and they can represent objects, features, or structures of interest in an image.
Input Binary Image

Isolated Blob Regions

Blob detection algorithms typically operate on grayscale or color images and involve the following steps:
- Preprocessing: The input image may be preprocessed to enhance or filter certain properties, such as contrast enhancement, noise reduction, or color normalization, depending on the specific application and image characteristics.
- Blob definition: The definition of a blob depends on the specific application and image properties. A blob can be defined based on its intensity, color, texture, or other image features. For example, in a grayscale image, a blob may be defined as a connected region of pixels with intensities above or below a certain threshold. In a color image, a blob may be defined as a connected region of pixels with similar color values within a certain range.
- Blob localization: Once the blobs are defined, the algorithm typically localizes them in the image by determining their position, size, and shape. This can be done using various techniques, such as finding connected components, region growing, or template matching. Some blob detection algorithms may also estimate additional properties of blobs, such as orientation, scale, or shape characteristics.
- Blob filtering: Blobs that are detected may undergo further filtering to remove false positives or noise. This can be done based on various criteria, such as size, shape, intensity, or contextual information. Filtering is an important step to improve the accuracy and reliability of the blob detection results.
- Blob representation: The detected blobs may be represented in different ways, depending on the specific application and the desired output. For example, blobs can be represented as bounding boxes, circles, ellipses, or other geometric shapes. Alternatively, blobs can be represented as feature vectors, histograms, or other numerical representations that can be used for further analysis or classification.
- Post Processing: After the blob detection and representation steps, post-processing may be performed, such as grouping or merging similar blobs, tracking blobs over time, or analyzing the spatial relationships between blobs.
A general purpose blob detector has been successfully implemented in SOD via the exported function sod_image_find_blobs(). The gist below highlight a typical usage of the built-in blob detector to isolate potential regions of interest for an OCR system for example.
Blob detection is widely used in various image processing and computer vision applications, such as document scanning, Face Anti-Spoofing, image analysis, and medical imaging. It is a versatile technique that can be adapted to different types of images and properties of interest, making it a powerful tool for many computer vision tasks.
Conclusion
In conclusion, the implementation of modern image processing algorithms in C offers a powerful and efficient approach for handling complex image analysis tasks. C's low-level nature and control over memory management provide opportunities for optimizing computational performance. With a solid understanding of image representation, data structures, and algorithmic concepts, developers can harness the potential of C to create robust and efficient solutions for image processing applications.
References
- https://www.iasj.net/iasj
- https://doi.org/10.1016/j.ijleo.2016.11.124
- https://sod.pixlab.io/c_api/sod_hilditch_thin_image.html
- http://www.math.tau.ac.il/~turkel/notes/otsu.pdf
- http://demo.ipol.im/demo/158/
- https://www.researchgate.net/publication/51978890_Minutiae_Extraction_from_Fingerprint_Images
- http://dx.doi.org/10.1109/TSMC.1979.4310076
- http://cgm.cs.mcgill.ca/~godfried/teaching/projects97/azar/skeleton.html
- https://en.wikipedia.org/wiki/Canny_edge_detector
- http://www.ipol.im/pub/art/2014/82/article.pdf
- https://www.mathworks.com/help/gpucoder/ug/feature-extraction-using-surf.html
- http://weitz.de/sift/
- http://citeseerx.ist.psu.edu/viewdoc/download?doi=10.1.1.149.4173&rep=rep1&type=pdf
- https://www.researchgate.net/figure/Original-SIFT-algorithm-flow_fig4_220242450
- FACEIO - Facial Authentication for the Web
- PixLab - Machine Vision & Media Processing APIs